
About i360’s Population & Migration Data: i360’s Population Data is a comprehensive dataset of address history and its demographics, for all individuals in i360’s comprehensive database of 270+ million US consumers.
The past three years in politics brought about a number of unexpected outcomes across the US. From Glenn Youngkin’s gubernatorial win to Republicans taking four New York House seats – voters now expect the unexpected. The 2024 election cycle is slated to bring more change. Many GOP candidates have already announced their plans to run, while the Biden administration is slated to soon announce their intentions.
Since the start of COVID, the country experienced an exodus out of mega-cities into suburban and exurban communities. Similarly, high-cost-of-living states, such as California and New York, witnessed net outflows – some for the first time in decades. This reversed flow continued post-Covid as remote work status untethered office workers from life in expensive city centers.
Analyzing our Population and Migration data together with other series of data in our proprietary database, i360’s in-house analysts looked to understand migration’s impact on state political leanings.
The maps below look at the difference between GOP and Democratic Party registration in states where party registration is required. The first map looks at the distribution of party registration in 2020; the second map shows the political leanings of individuals moving into the state from 2021 – 2022, and the third map looks at the current distribution of political leanings. In 2020, California Democrats held a 31.2% advantage over Republicans in terms of registration. During 2021 – 2022, Democrats continued to move into the state, outnumbering Republicans by 42.9%. As a result, the third map shows that California Democrats now outnumber conservatives by 32.6%. On the other hand, we see Republicans make important registration gains in Arizona, Kentucky, and West Virginia in the last few years.
Party Registration States 2020
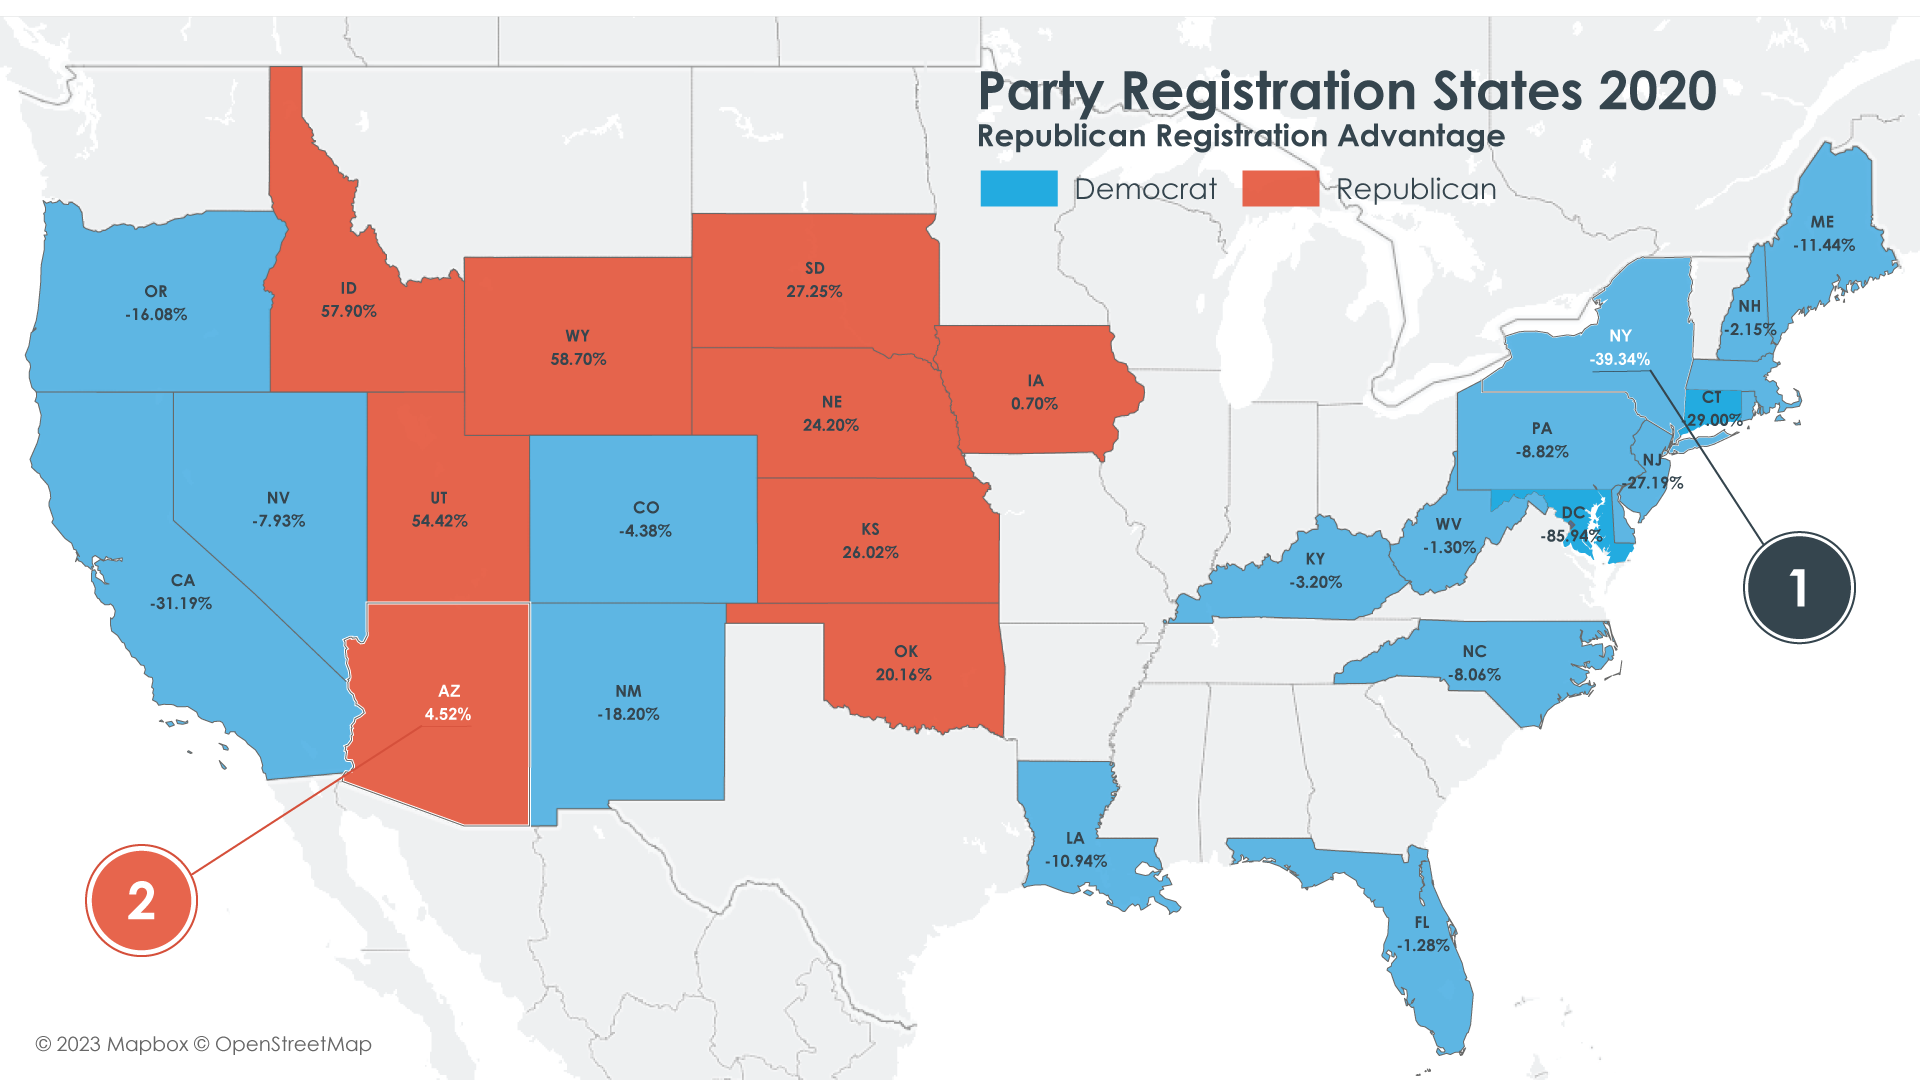
- New York State Democrats hold a high registration advantage of ~ 40% over Republicans when measured against one another.
- In Arizona, Republican registration is 5% higher than that of Democrats when compared directly.
State Inflow Republican vs. Democrat: 2021 – 2022
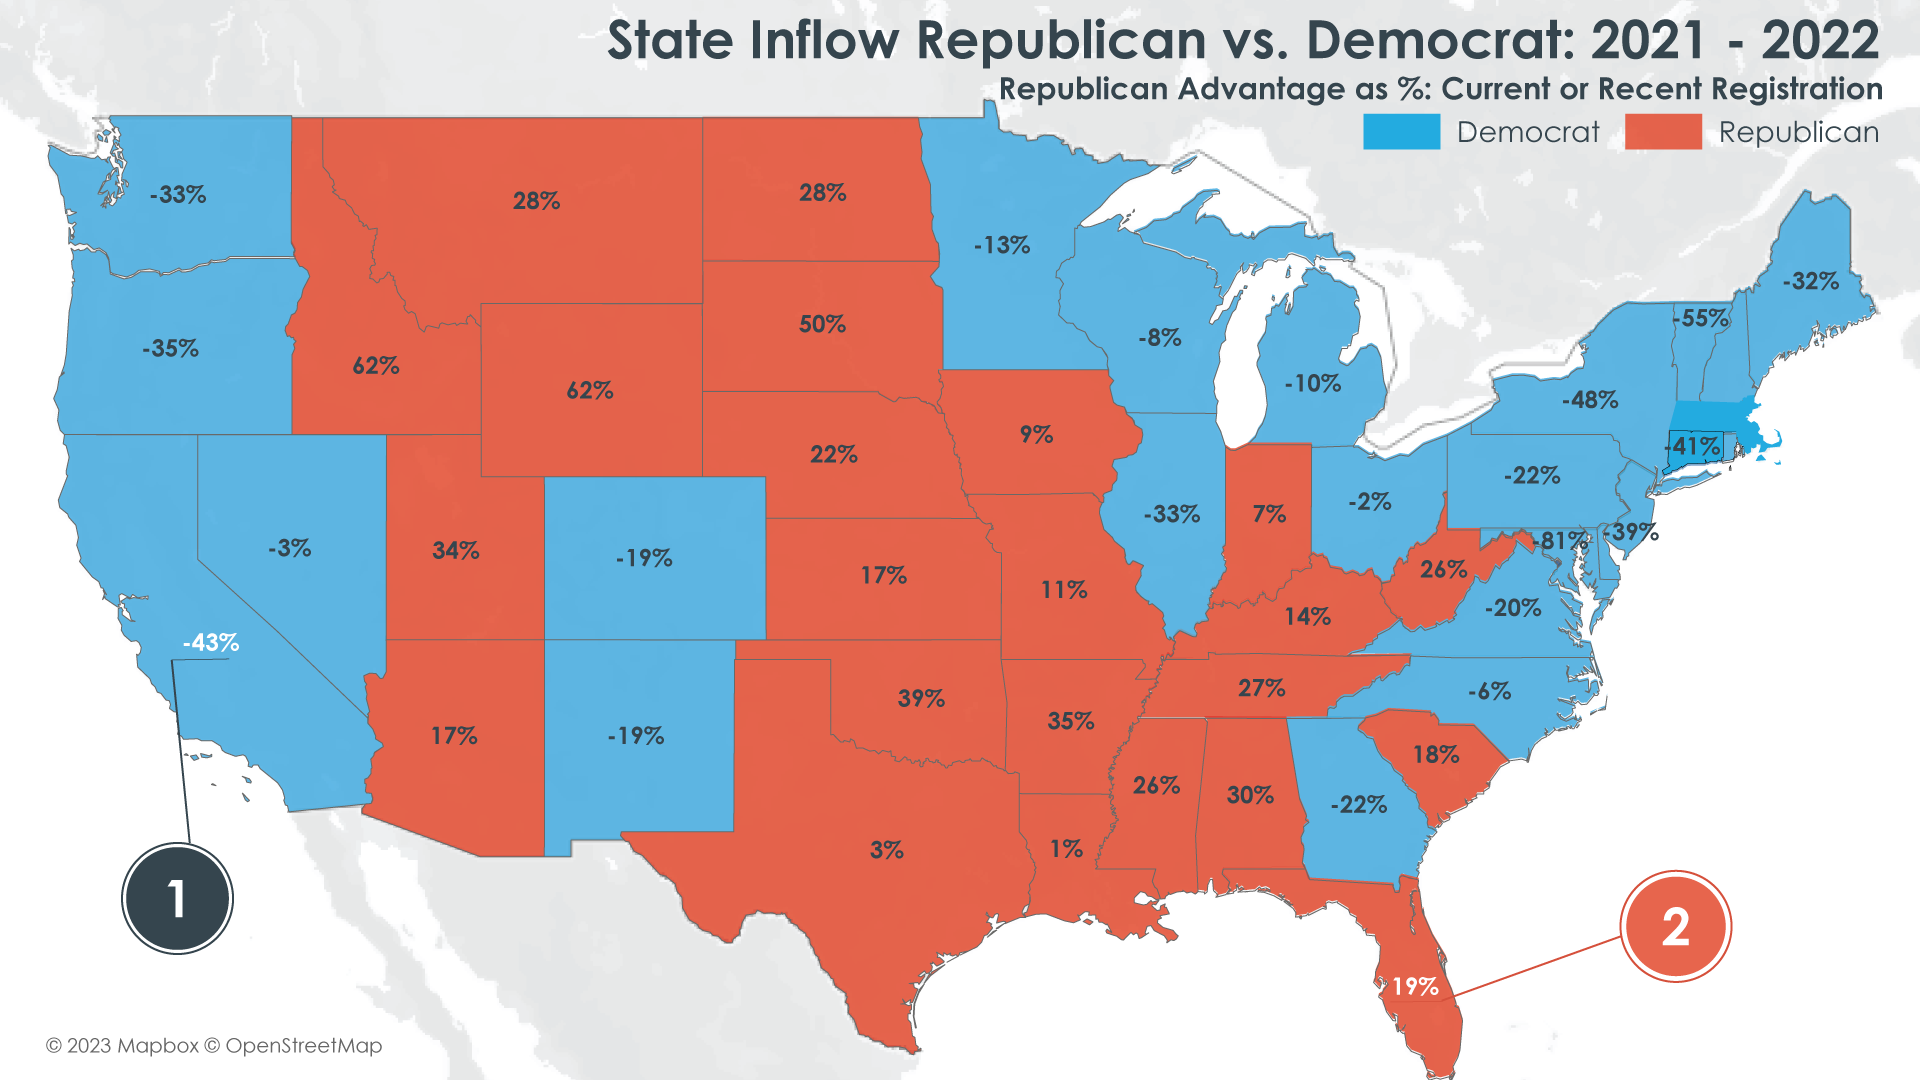
- California-bound Democrats outnumber the Republicans moving to the state by ~43%
- In contrast to California, about 19% more Republicans moved to Florida than Democrats when we consider prior and current state registration records.
Party Registration States Current
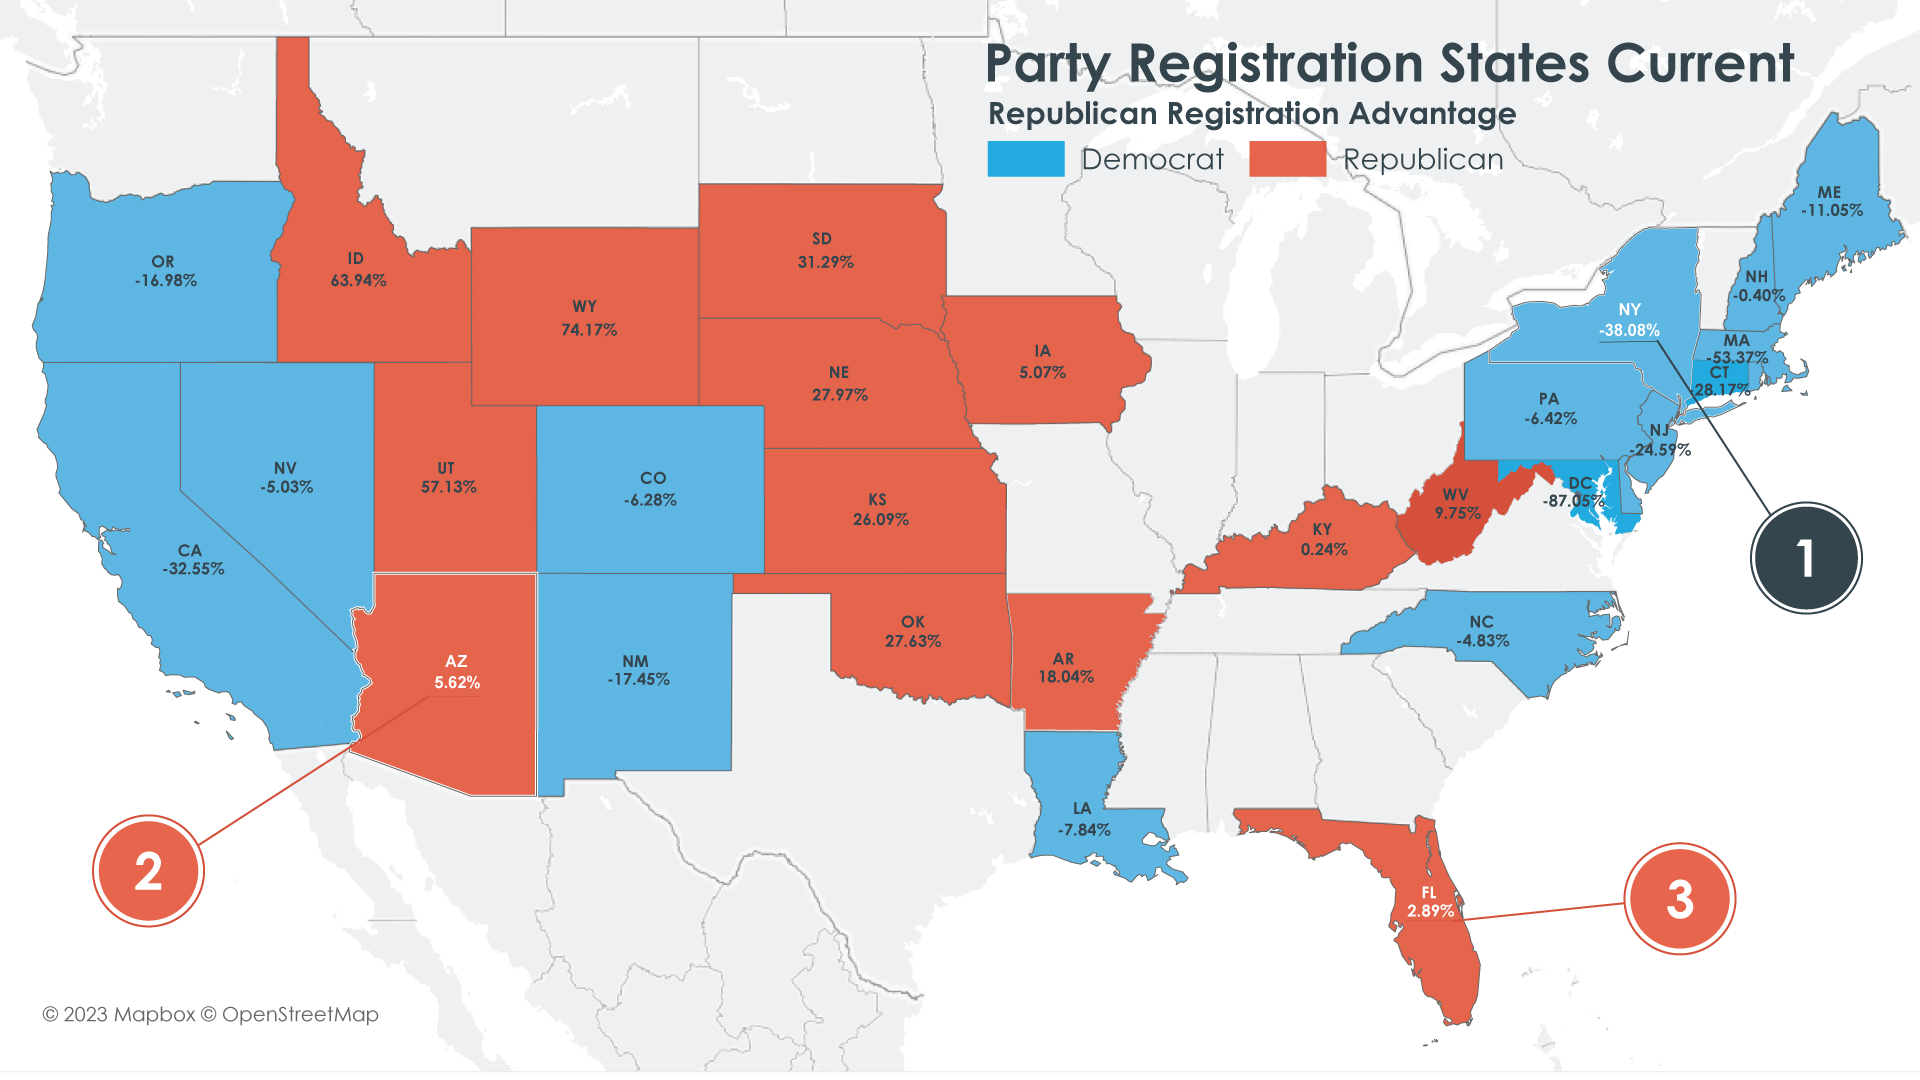
- Republican registration in New York State has picked up slightly from 2020.
- Arizona is showing a slight uptick in Republican registration over 2020.
- Florida, Kentucky, and West Virginia are all showing changes in registration favoring Republicans.
To understand the implications of inter-state migration on political leanings, we look at voter registration over the past three years and analyze individual registration at the aggregate. If an individual registered in multiple states over time, we consider their most recent registration. Secondly, we consider only movers between states who have either previously registered to vote or registered in their destination state. This is just one way to subset our Population and Migration data, and many other viewpoints are possible. Taking a deeper dive, we selected Arizona and New York to show how interstate migration adds up to change in both a battleground state and a party stronghold.
Outflow to Arizona
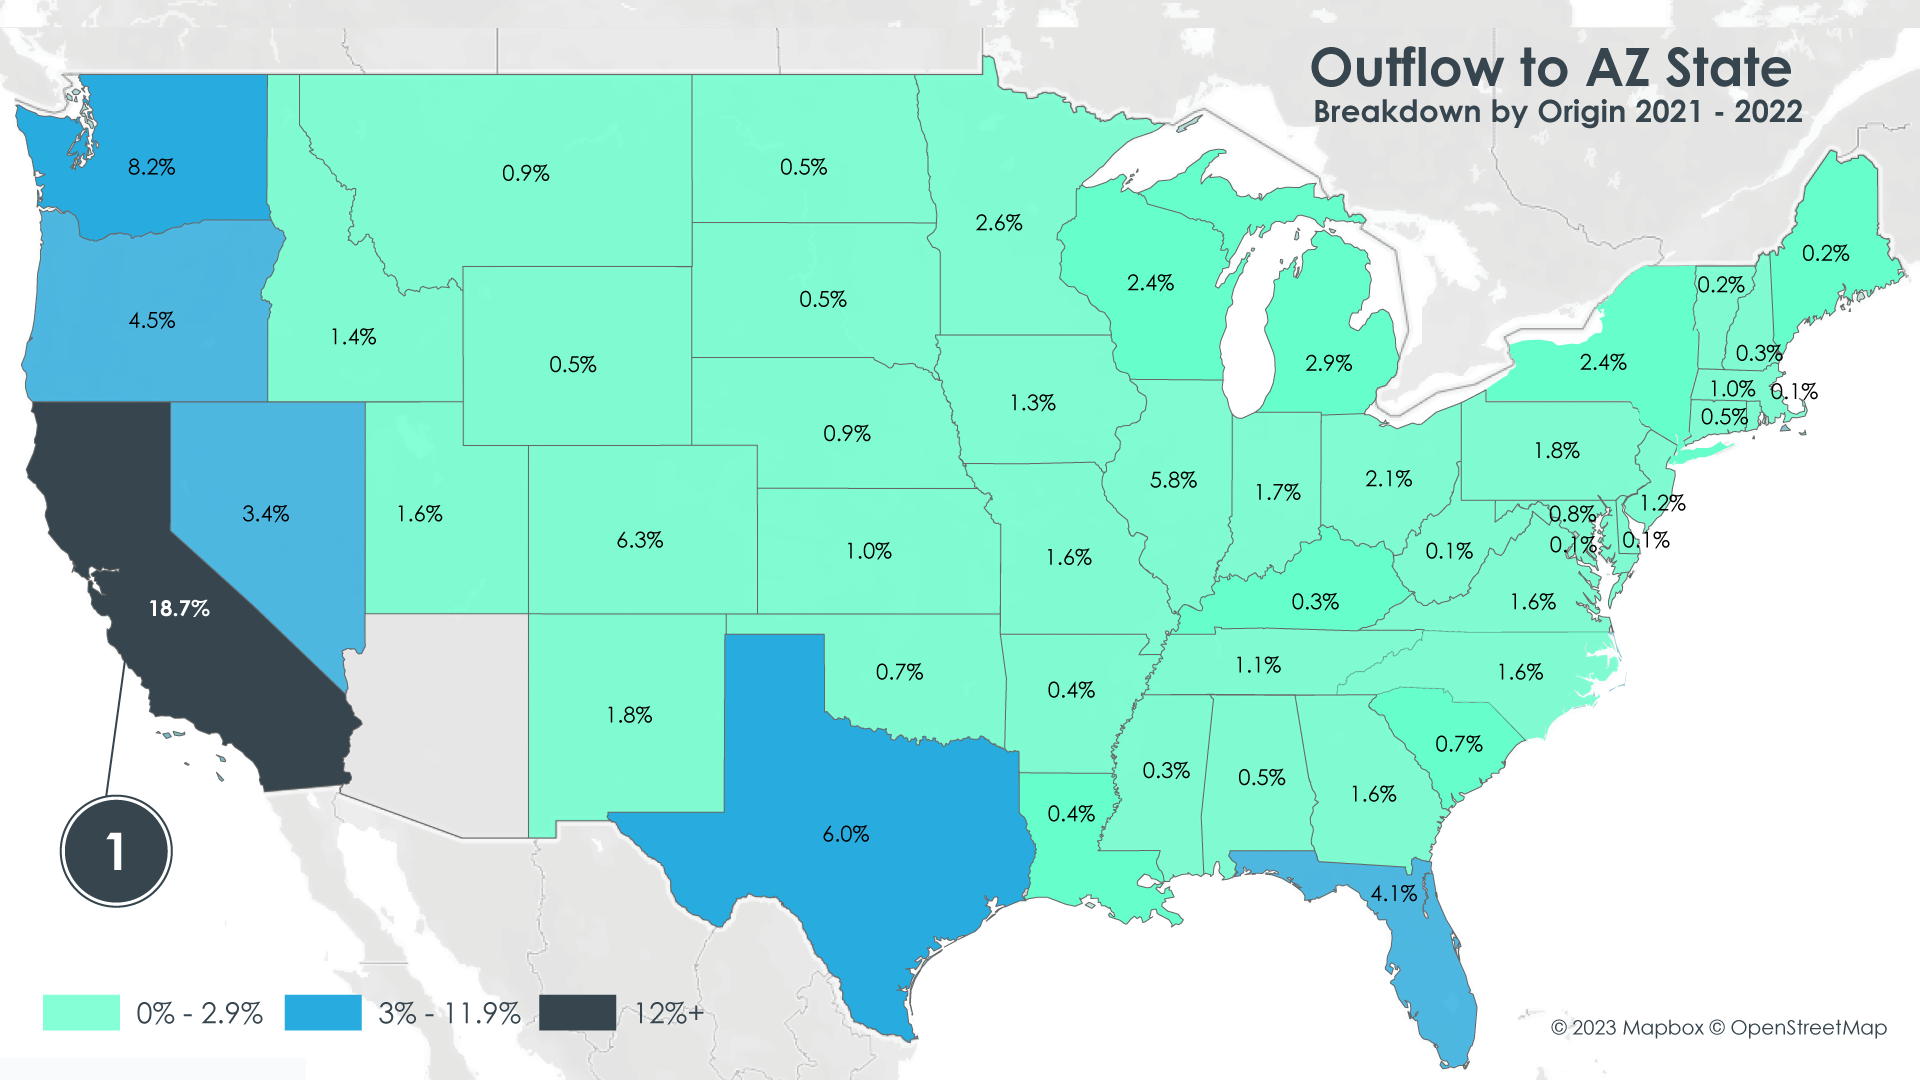
- 18.7% of interstate movers to Arizona came from California.
In 2020, Biden won the state of Arizona with approximately 10,000 votes. Similarly, in 2022, 17,117 votes determined the outcome of the Arizona Gubernatorial election. These are slim margins for any state – but especially one as large as Arizona. With over 4.1 million registered voters as of January 2023, these candidates won at the margins, asking the question, what effect will population inflows have on future elections?
The map above gives a state-by-state breakdown across the continental US for Arizona’s 2021 – 2022 inflows. The two tables below show the political leanings of Arizona-bound movers who are currently registered in Arizona or who were registered for the 2020 election in another state. Unregistered individuals are not included in these figures.
Looking below, while the ‘Democrat’ and ‘Republican’ categories are obvious, ‘Other’ refers to any political party outside of the main two but is almost entirely composed of unaffiliated voters. Across nearly every state we researched, unaffiliated voters comprise most movers – consistent with national trends. As a result, we should expect to see the ‘Other’ category dominate a more granular breakdown by the mover’s origin state – interestingly, this is not always the case.
Arizona Inflows 2021 – 2022
Breakdown by origin and recent registration. Ranked by voter registration count.
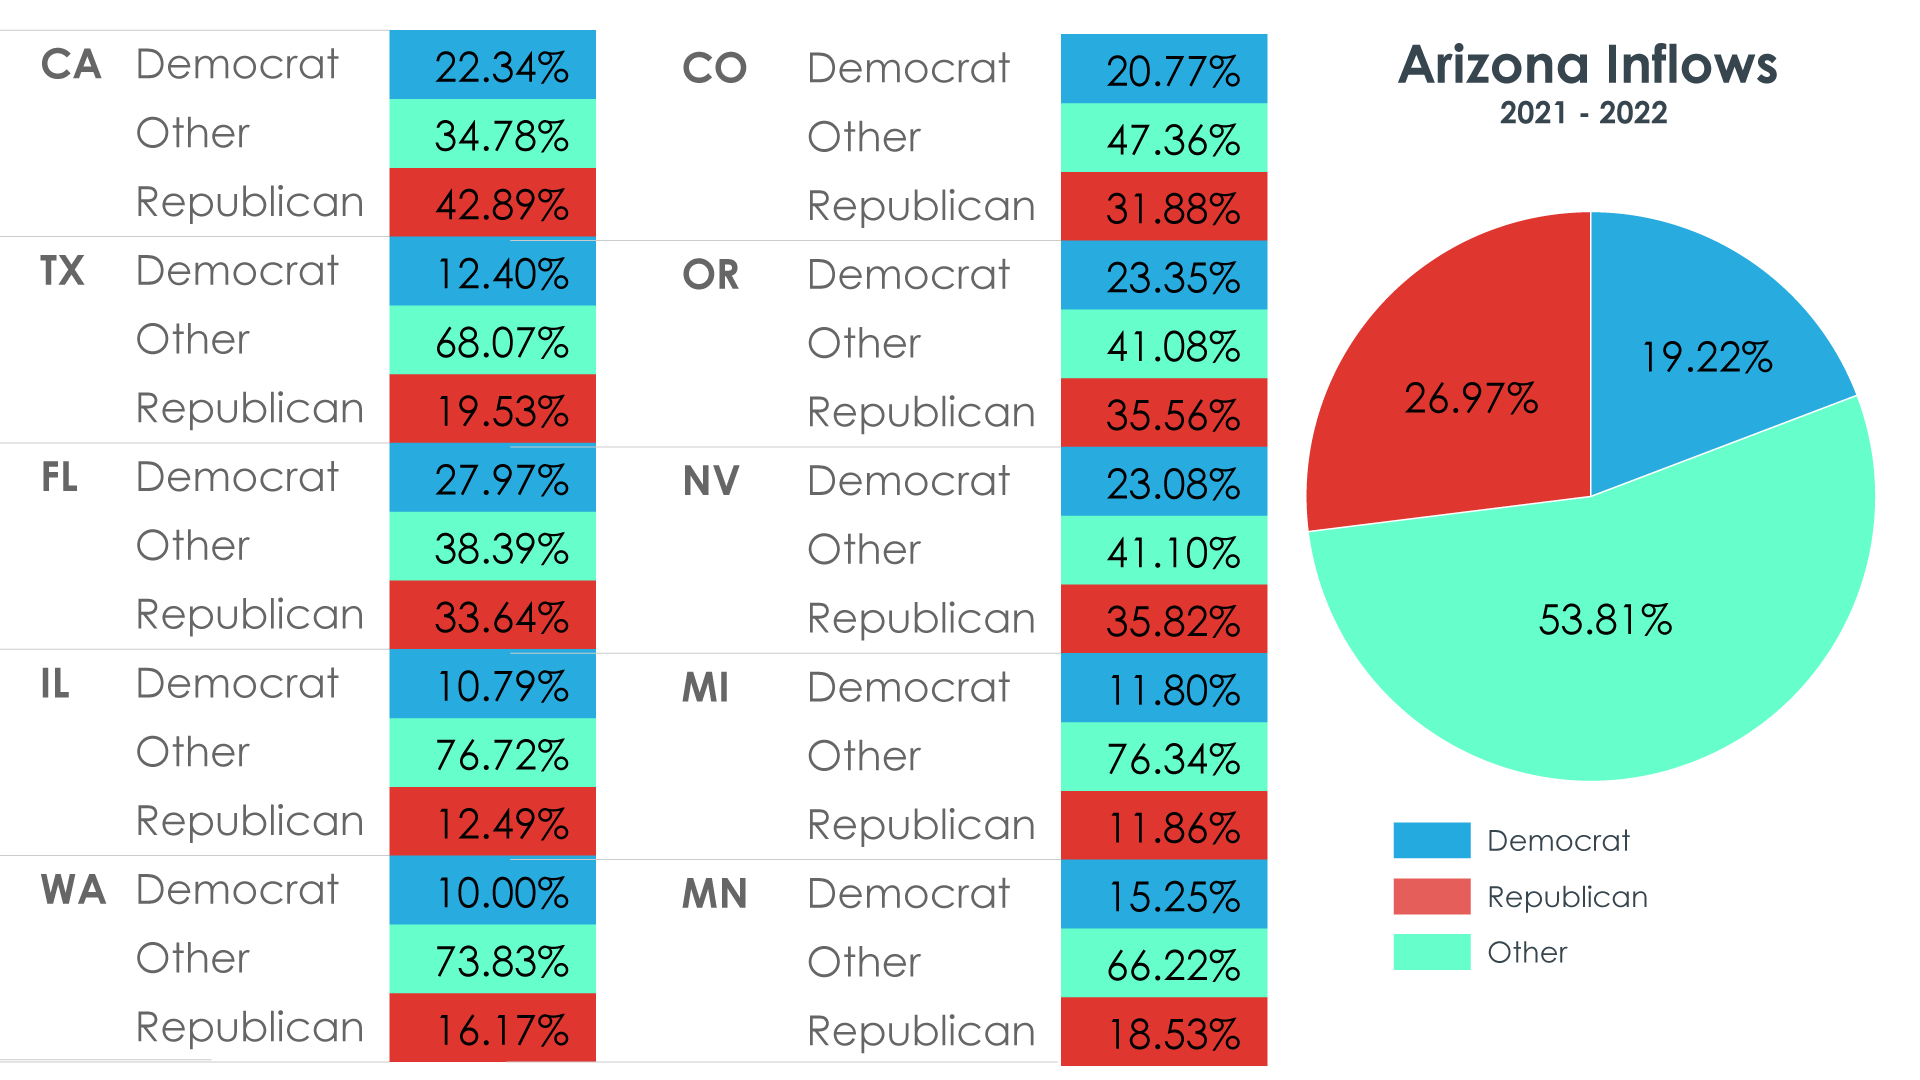
The table above lists the top ten origin states for voter-registered Arizona-bound movers sorted by total inflow from 2021 – 2022. The right-most column shows the percentage breakdown by party from each outflow state. The first trend is that the ‘Other’ category is often the largest. The second trend shows Republicans vastly outnumbering the Democrat cohort of movers. Even more so, in the case of California, Republicans also outnumber ‘Other’ movers. Of course, correlation doesn’t imply causation, but the insight still stands. The California case stands out even more as recent registration numbers show a near 2 to 1 Democrat to Republican ratio in the Golden State.
These sorts of demographic shifts can impact election outcomes. The above map details a growing Republican registration advantage in Arizona. The 2023 AZ Secretary of State numbers echo our sentiment that Republicans are outpacing Democrats in registration. According to our Population and Migration data, out-of-state inflows are an important driving force but not the only factor. A variety of reasons may keep voters from the ballot box, but these demographic shifts could give Republicans a decisive advantage.
Outflow to New York State
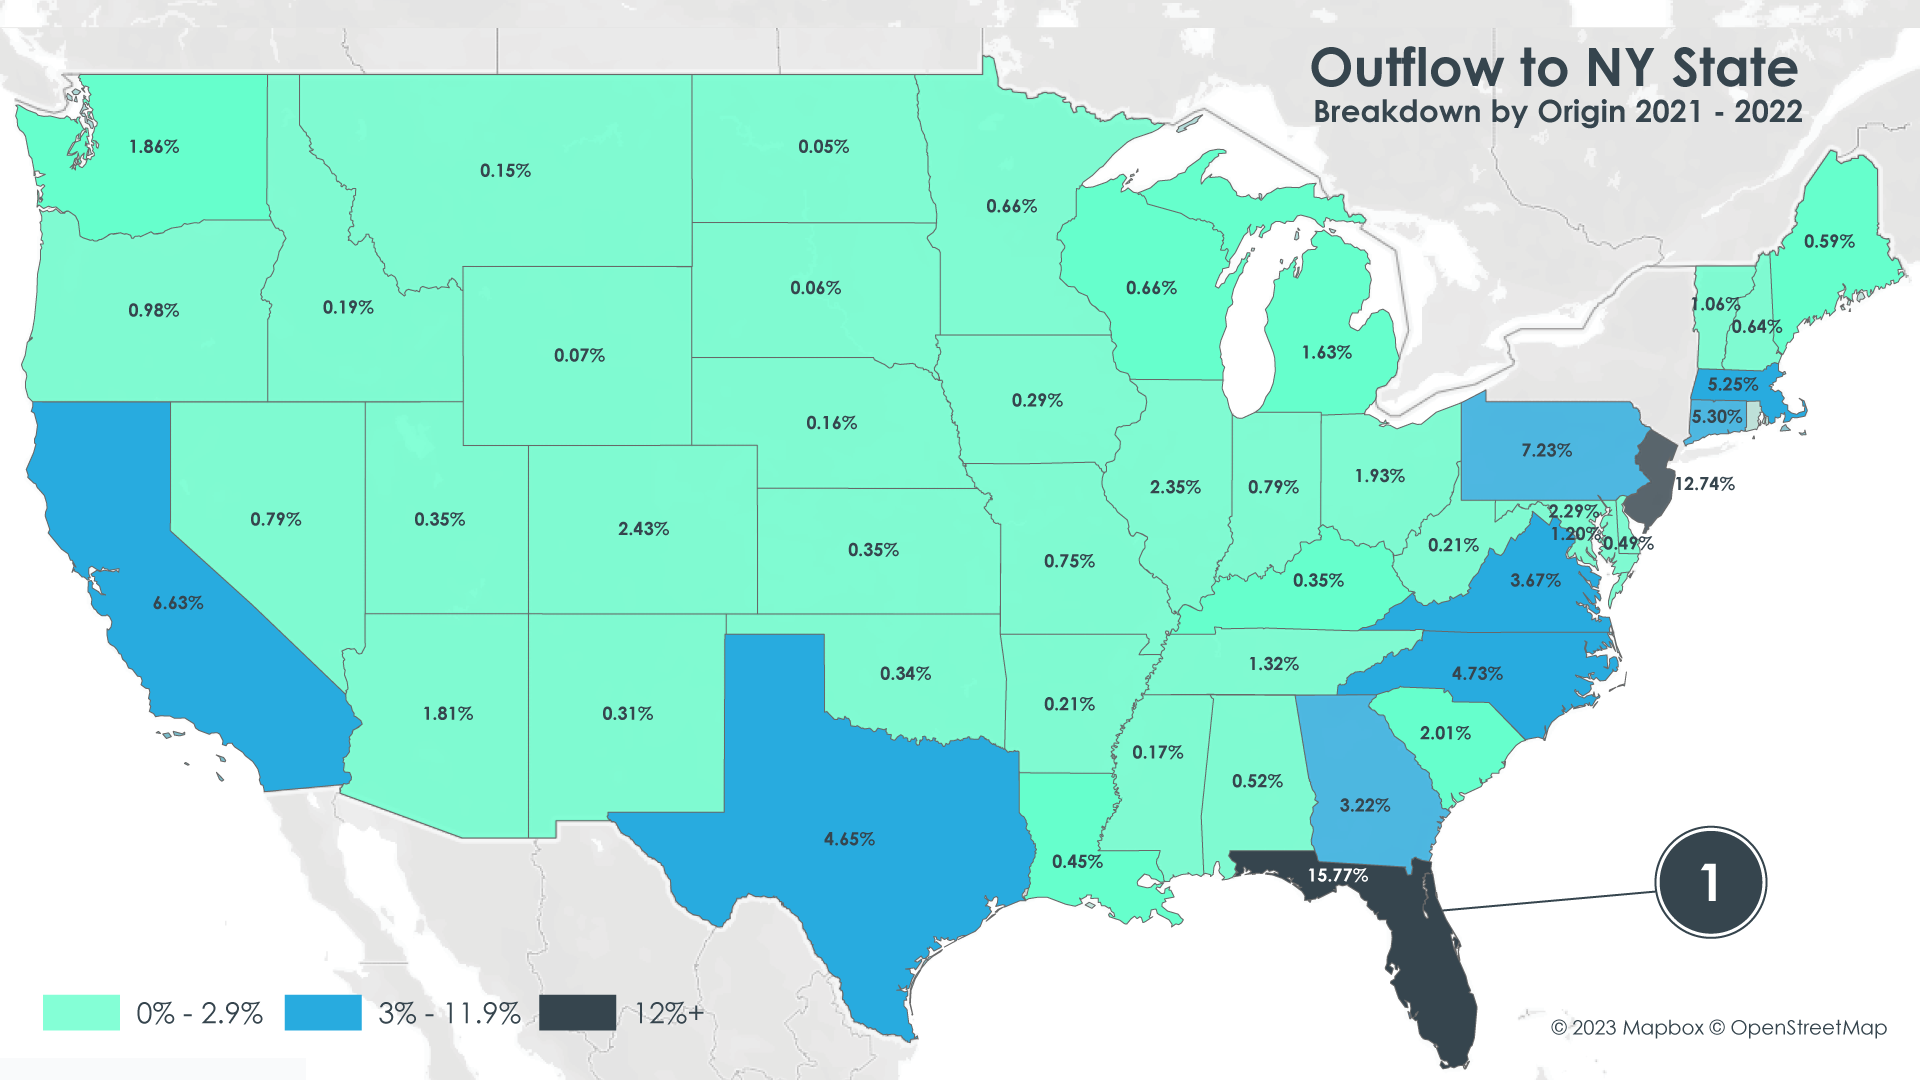
- A significant proportion of New York-bound movers come from Florida. Further analysis shows that this supersedes any “snowbird” effect.
Looking at a party stronghold, Democrats currently hold 66% of New York State’s senate seats. Democratic party domination occurs throughout the state’s government. This pattern emanates outwards from cities, with Republicans holding power in more rural areas. It is likely that Democratic candidates will continue to win elections in New York City for the foreseeable future. When we remove New York City from the analysis, interesting findings surface.
Looking at the map above, while Arizona primarily intakes movers from neighboring California, New York breaks this pattern entirely. More than any neighboring state, Florida contributes the most out-of-state movers to New York. In fact, the number two inflow state, Pennsylvania, contributes less than half the number of inflows as Florida. The political affinity of movers from Florida is split evenly between Republicans, Democrats, and ‘Other.’
Outflow rates from New York State over the past several years have been extraordinary. For every out-of-state Democrat moving into New York, how many in-state Democrats leave? Conversely, what is the relationship between Republicans and ‘Other’ voters?
i360s Population and Migration data shows the following results for New York State (New York City excluded) from 2021 – 2022:
Democrats: For every 5.2 Democrats leaving, one moves in.
Others (mainly Independents): For every 3.16 “Others” leaving, one moves in.
Republicans: For every 4.49 Republicans leaving, one moves in.
The takeaway is that New York State is losing inhabitants across the board. However, out-of-state ‘Other’ classified voters and Republicans are moving to areas outside of New York City at higher rates than out-of-state Democrats. The Democratic party has suffered losses in Upstate New York. Although they still have a larger number of members than other parties, this could potentially lead to a shift in power for Republicans. The Democratic Party’s registration advantage of 3.4M could be so heavily concentrated in the largest cities that Republicans pick up important State House and Senate seats in rural, exurban, and suburban areas. If what’s past is prologue, then New York Republican success in 2022 could be a sign of things to come in 2024.
Conclusion
As the 2024 election cycle approaches, hotly contested battleground states, and party strongholds stomping grounds are at stake. Recent waves of migration could play an important role in determining the outcome of state and federal elections. To stay informed on migration trends, subscribe to i360’s Population and Migration data for updates on crucial demographic and migration trends.
Disclosure: The information in these blog posts, based on i360’s Population and Migration data, is for informational purposes only and should not be construed as investment advice on any matter.